As you may have read the Sun had a bit of a temper tantrum earlier this month. Here's a great video of the flares (there are actually two of them in rapid succession) from NASA's Solar Dynamics Observatory.
And here is a time-lapse movie of the strong northern lights the storm generated when it hit Earth's magnetosphere.
With the solar cycle just heating up, it may be a stormy couple years.
Showing posts with label Sun. Show all posts
Showing posts with label Sun. Show all posts
Friday, March 16, 2012


Tuesday, March 8, 2011
Tuesday, December 7, 2010
New Mega-Filament Captured On Sun.
I'm not a filament expert so I won't write much other than to say: Look at this amazing "Mega-filament" captured by NASA's Solar Dynamics Observatory.
Click on image to watch as a Video.

Image credit: NASA's Solar Dynamics Observatory. Enjoy. :)
Click on image to watch as a Video.

Image credit: NASA's Solar Dynamics Observatory. Enjoy. :)
Thursday, November 4, 2010
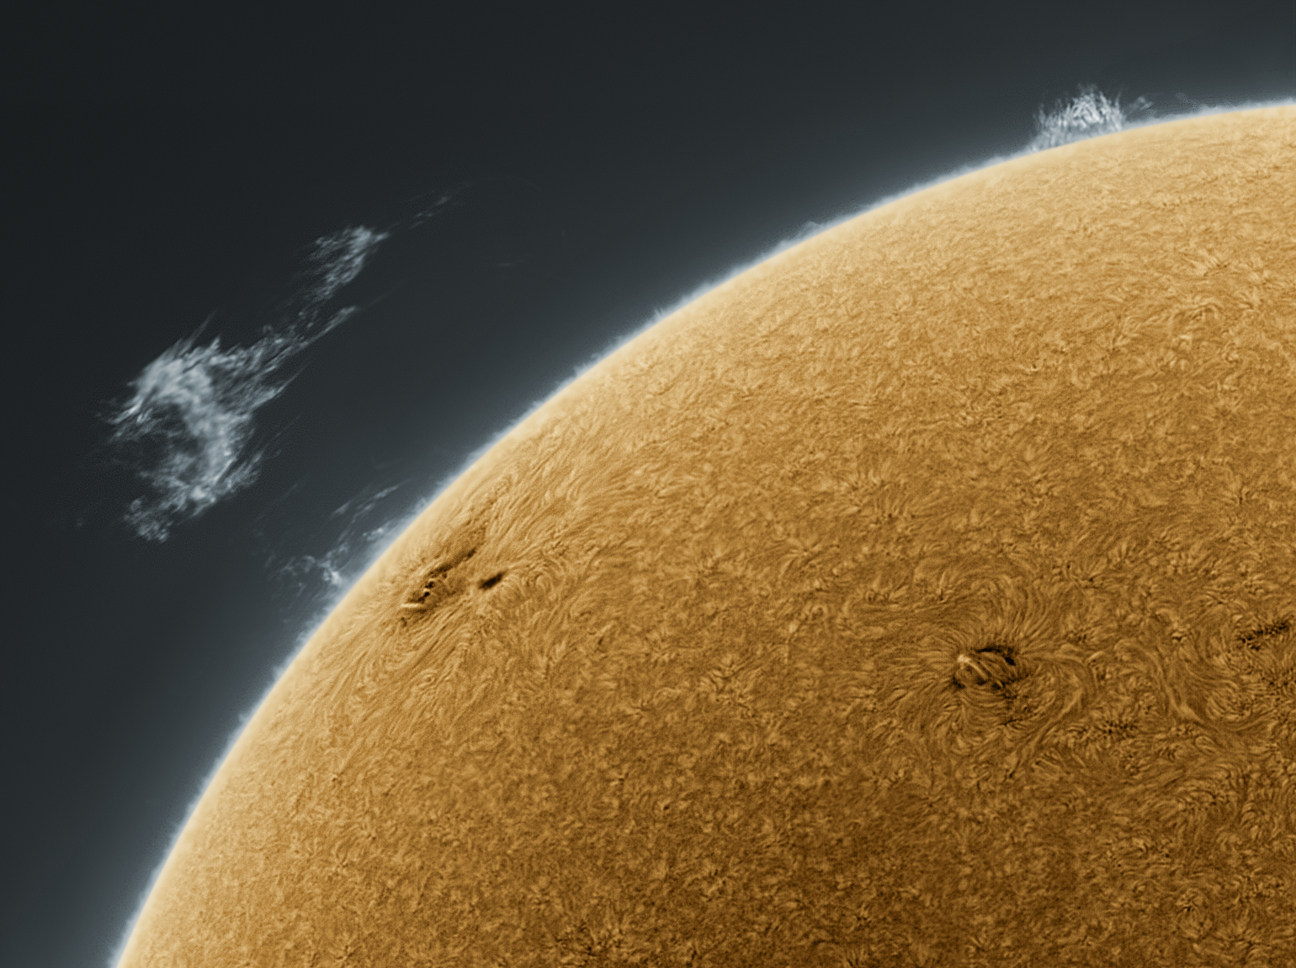
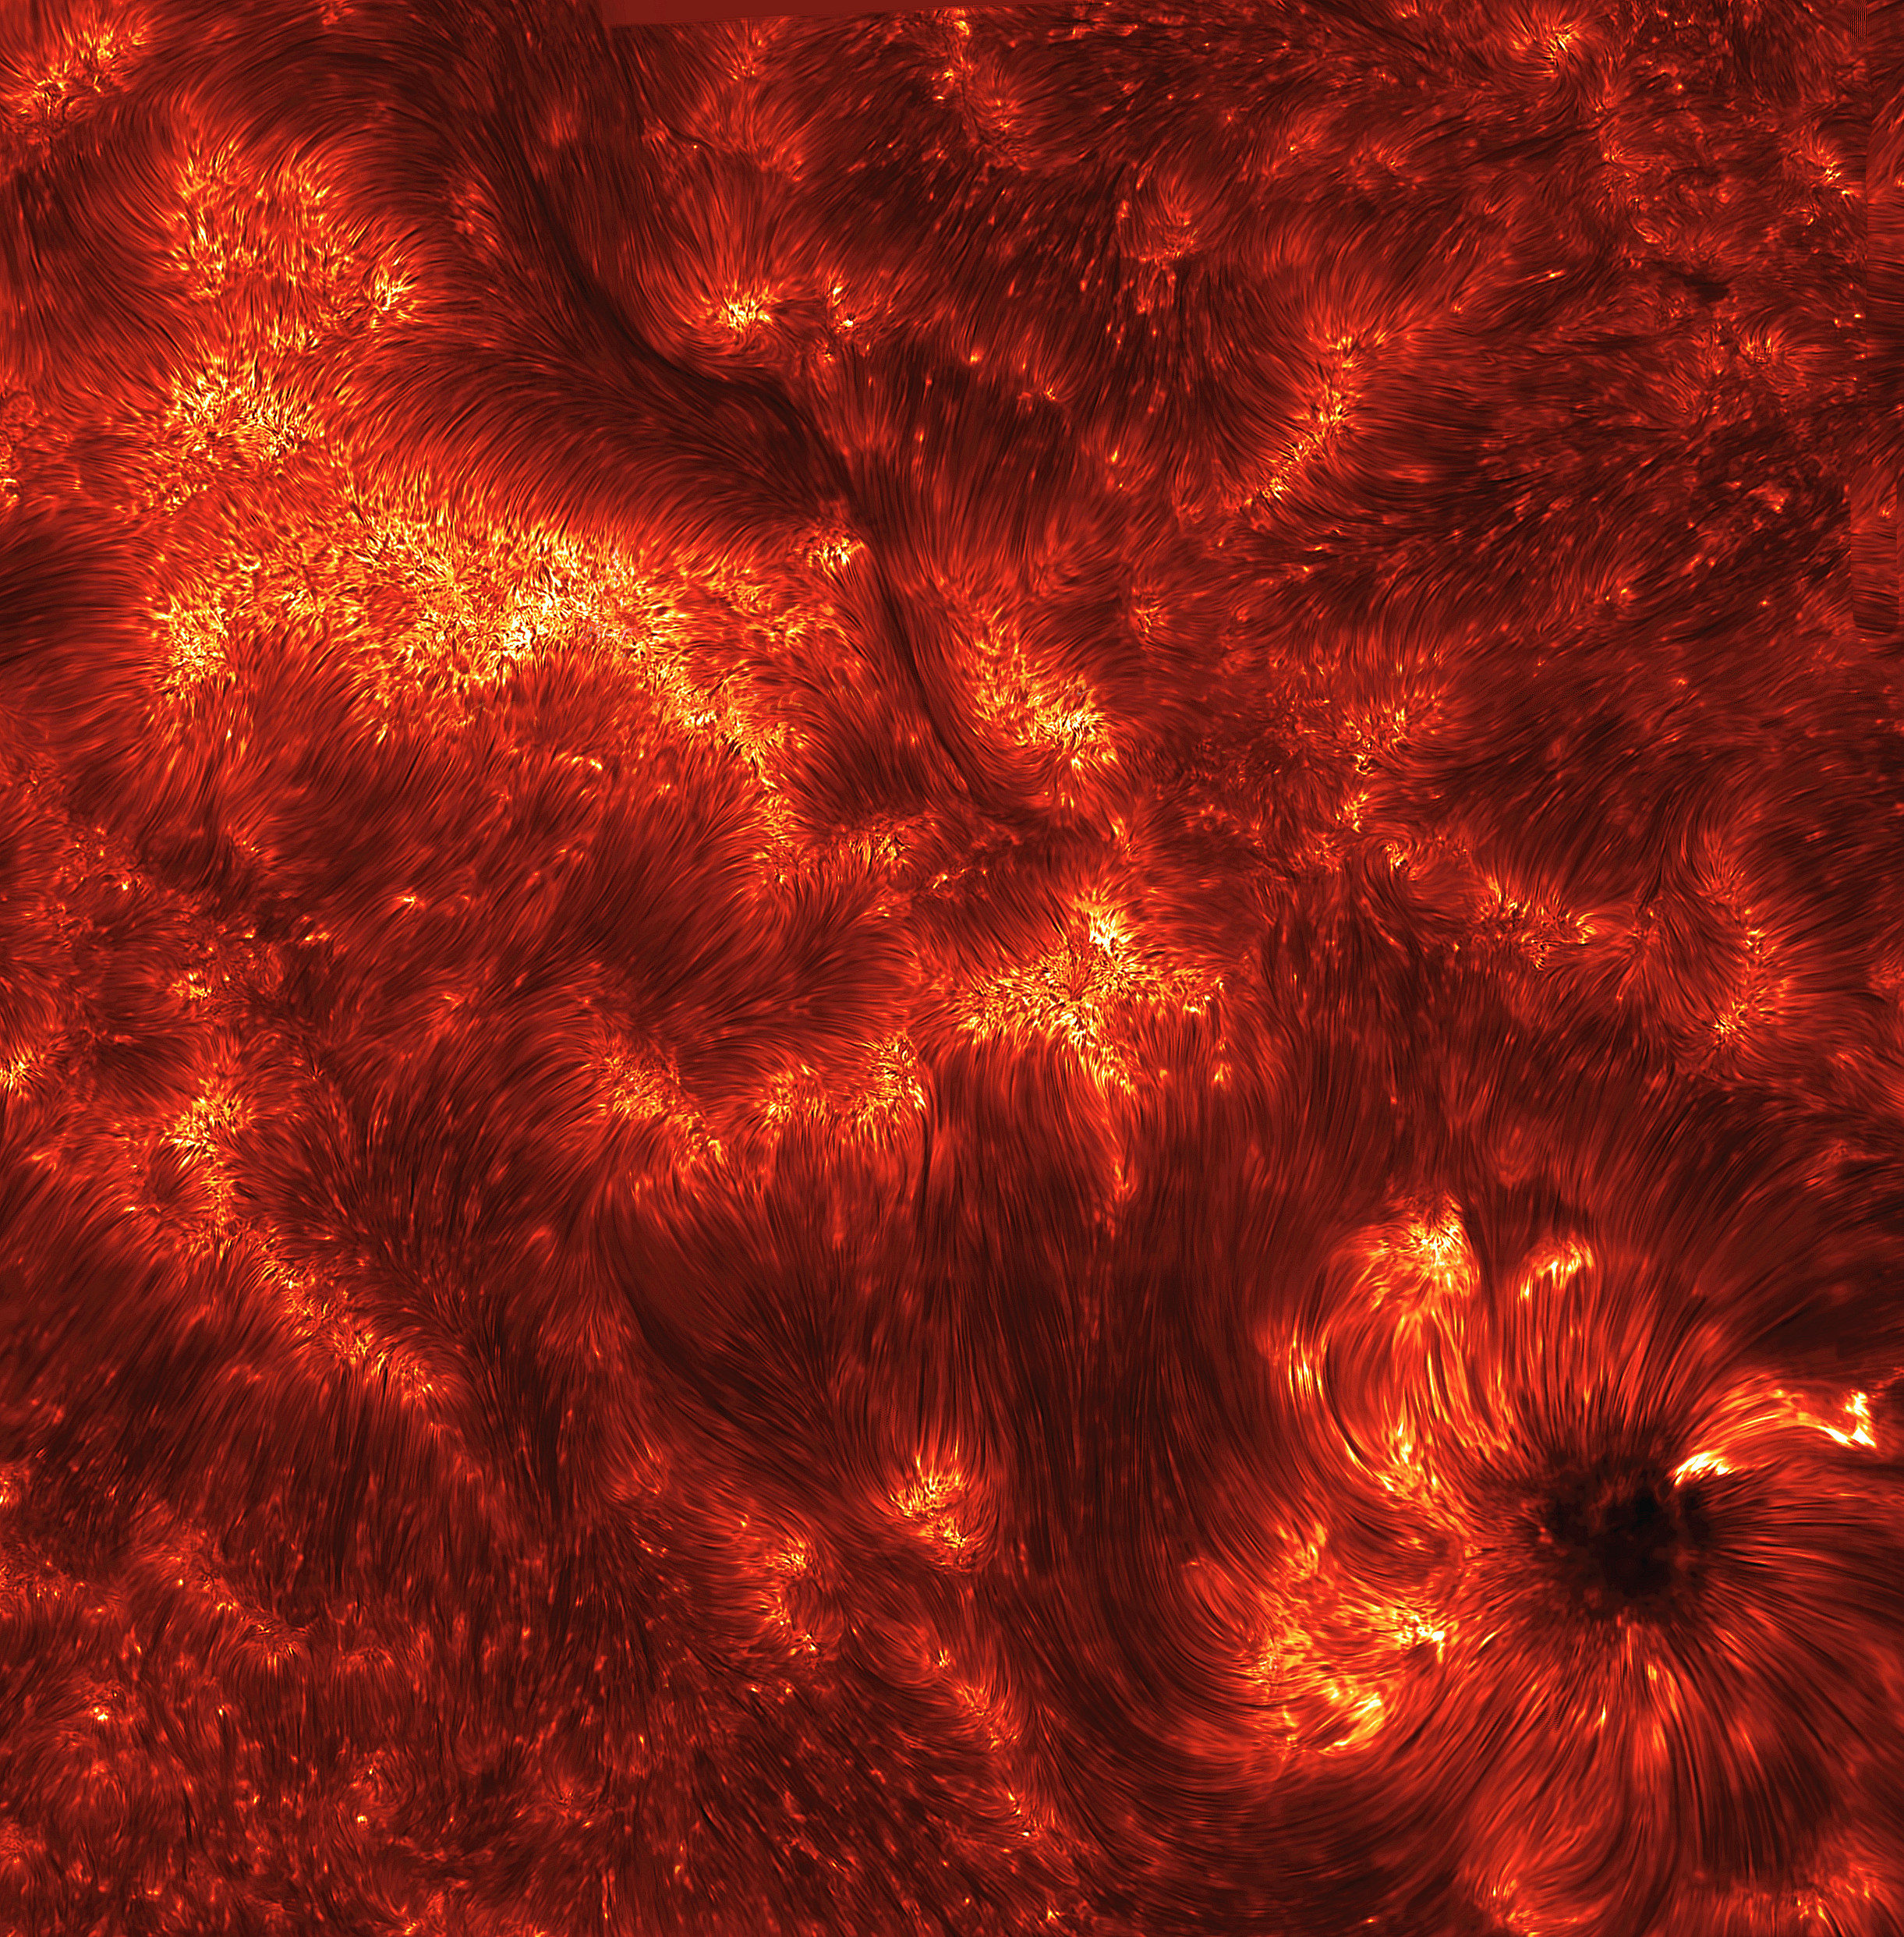
Our Beautiful Sun
Astronomy has its disadvantages but the beauty of its images sure isn't one of them.
 Click to embiggen.
Hat tip to APOD and Italy.
Hat tip to APOD and Italy.
Friday, October 29, 2010
Python Versus IDL For Astronomers and Our Beautiful Sun.
Given our recent trashing of IDL I thought I would be fair and admit:

- The majority of the plotting issues we discussed have actually been addressed in the new IDL 8.0.
- AstroBetter, a site with the purpose of providing "tips and tricks for professional astronomers", has a good honest assessment of the pros and cons of IDL versus Python. (A list that is continuously updated.)
That said, I will point out a few things (being the biased person I am):
- There are real reasons why the Hubble, James Webb space telescope and ALMA teams as well as STScI are migrating a lot of their code base to Python .
- For that matter, this is why CERN is providing python wrappers for their major pieces of software like ROOT.
- I agree with these decisions. :)
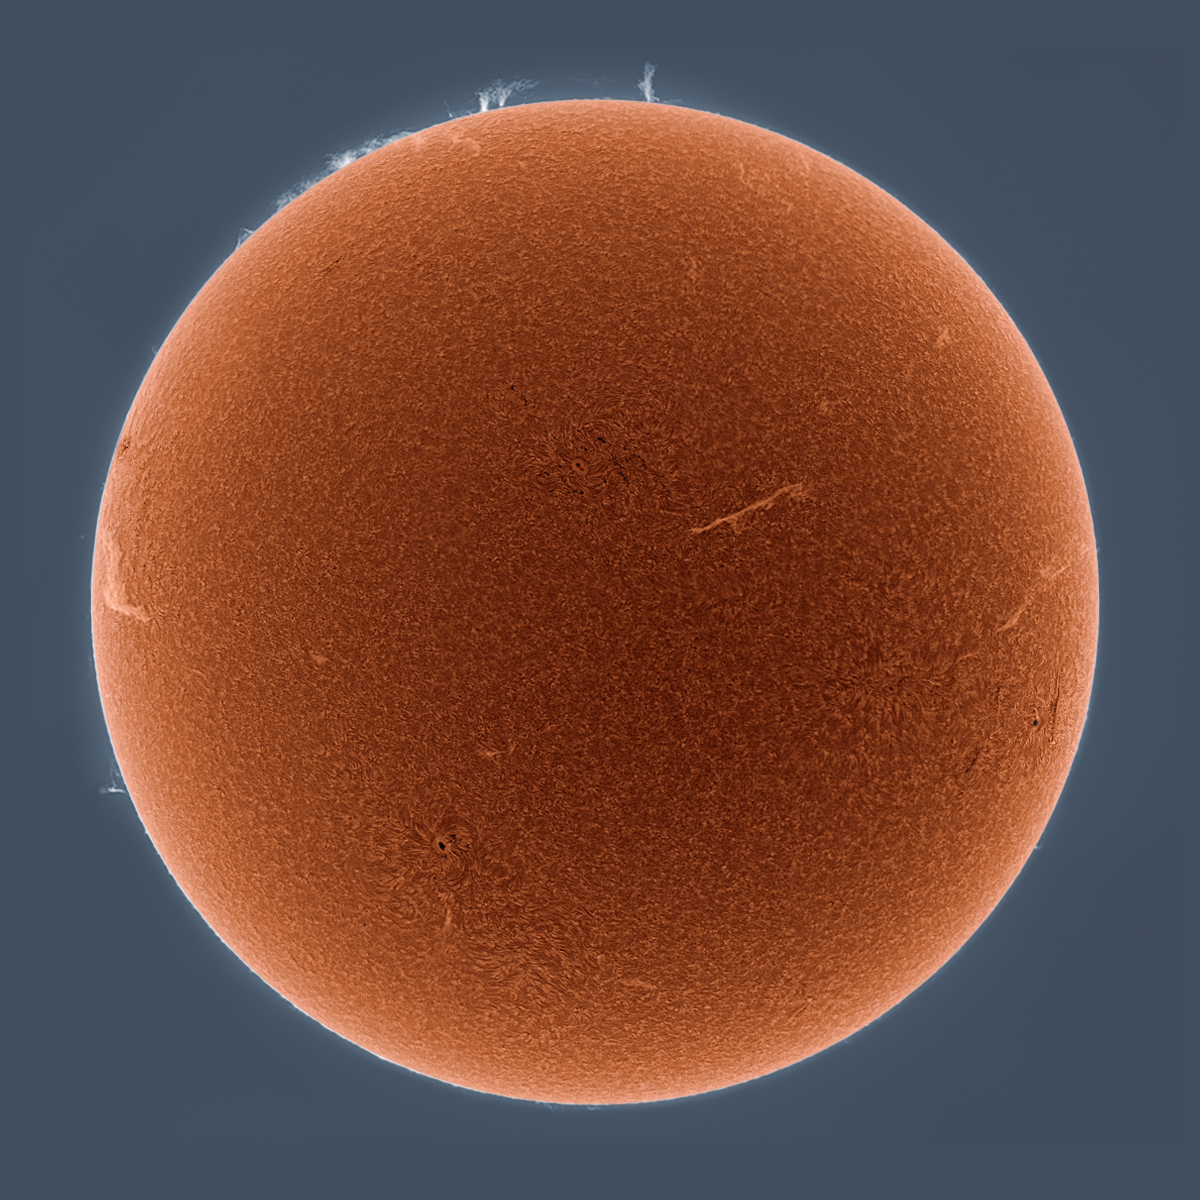
Just some observations. That said, enjoy a beautiful picture of the sun taken by Alan Friedman:
Tuesday, August 31, 2010
Spots in Southern California, Part 3
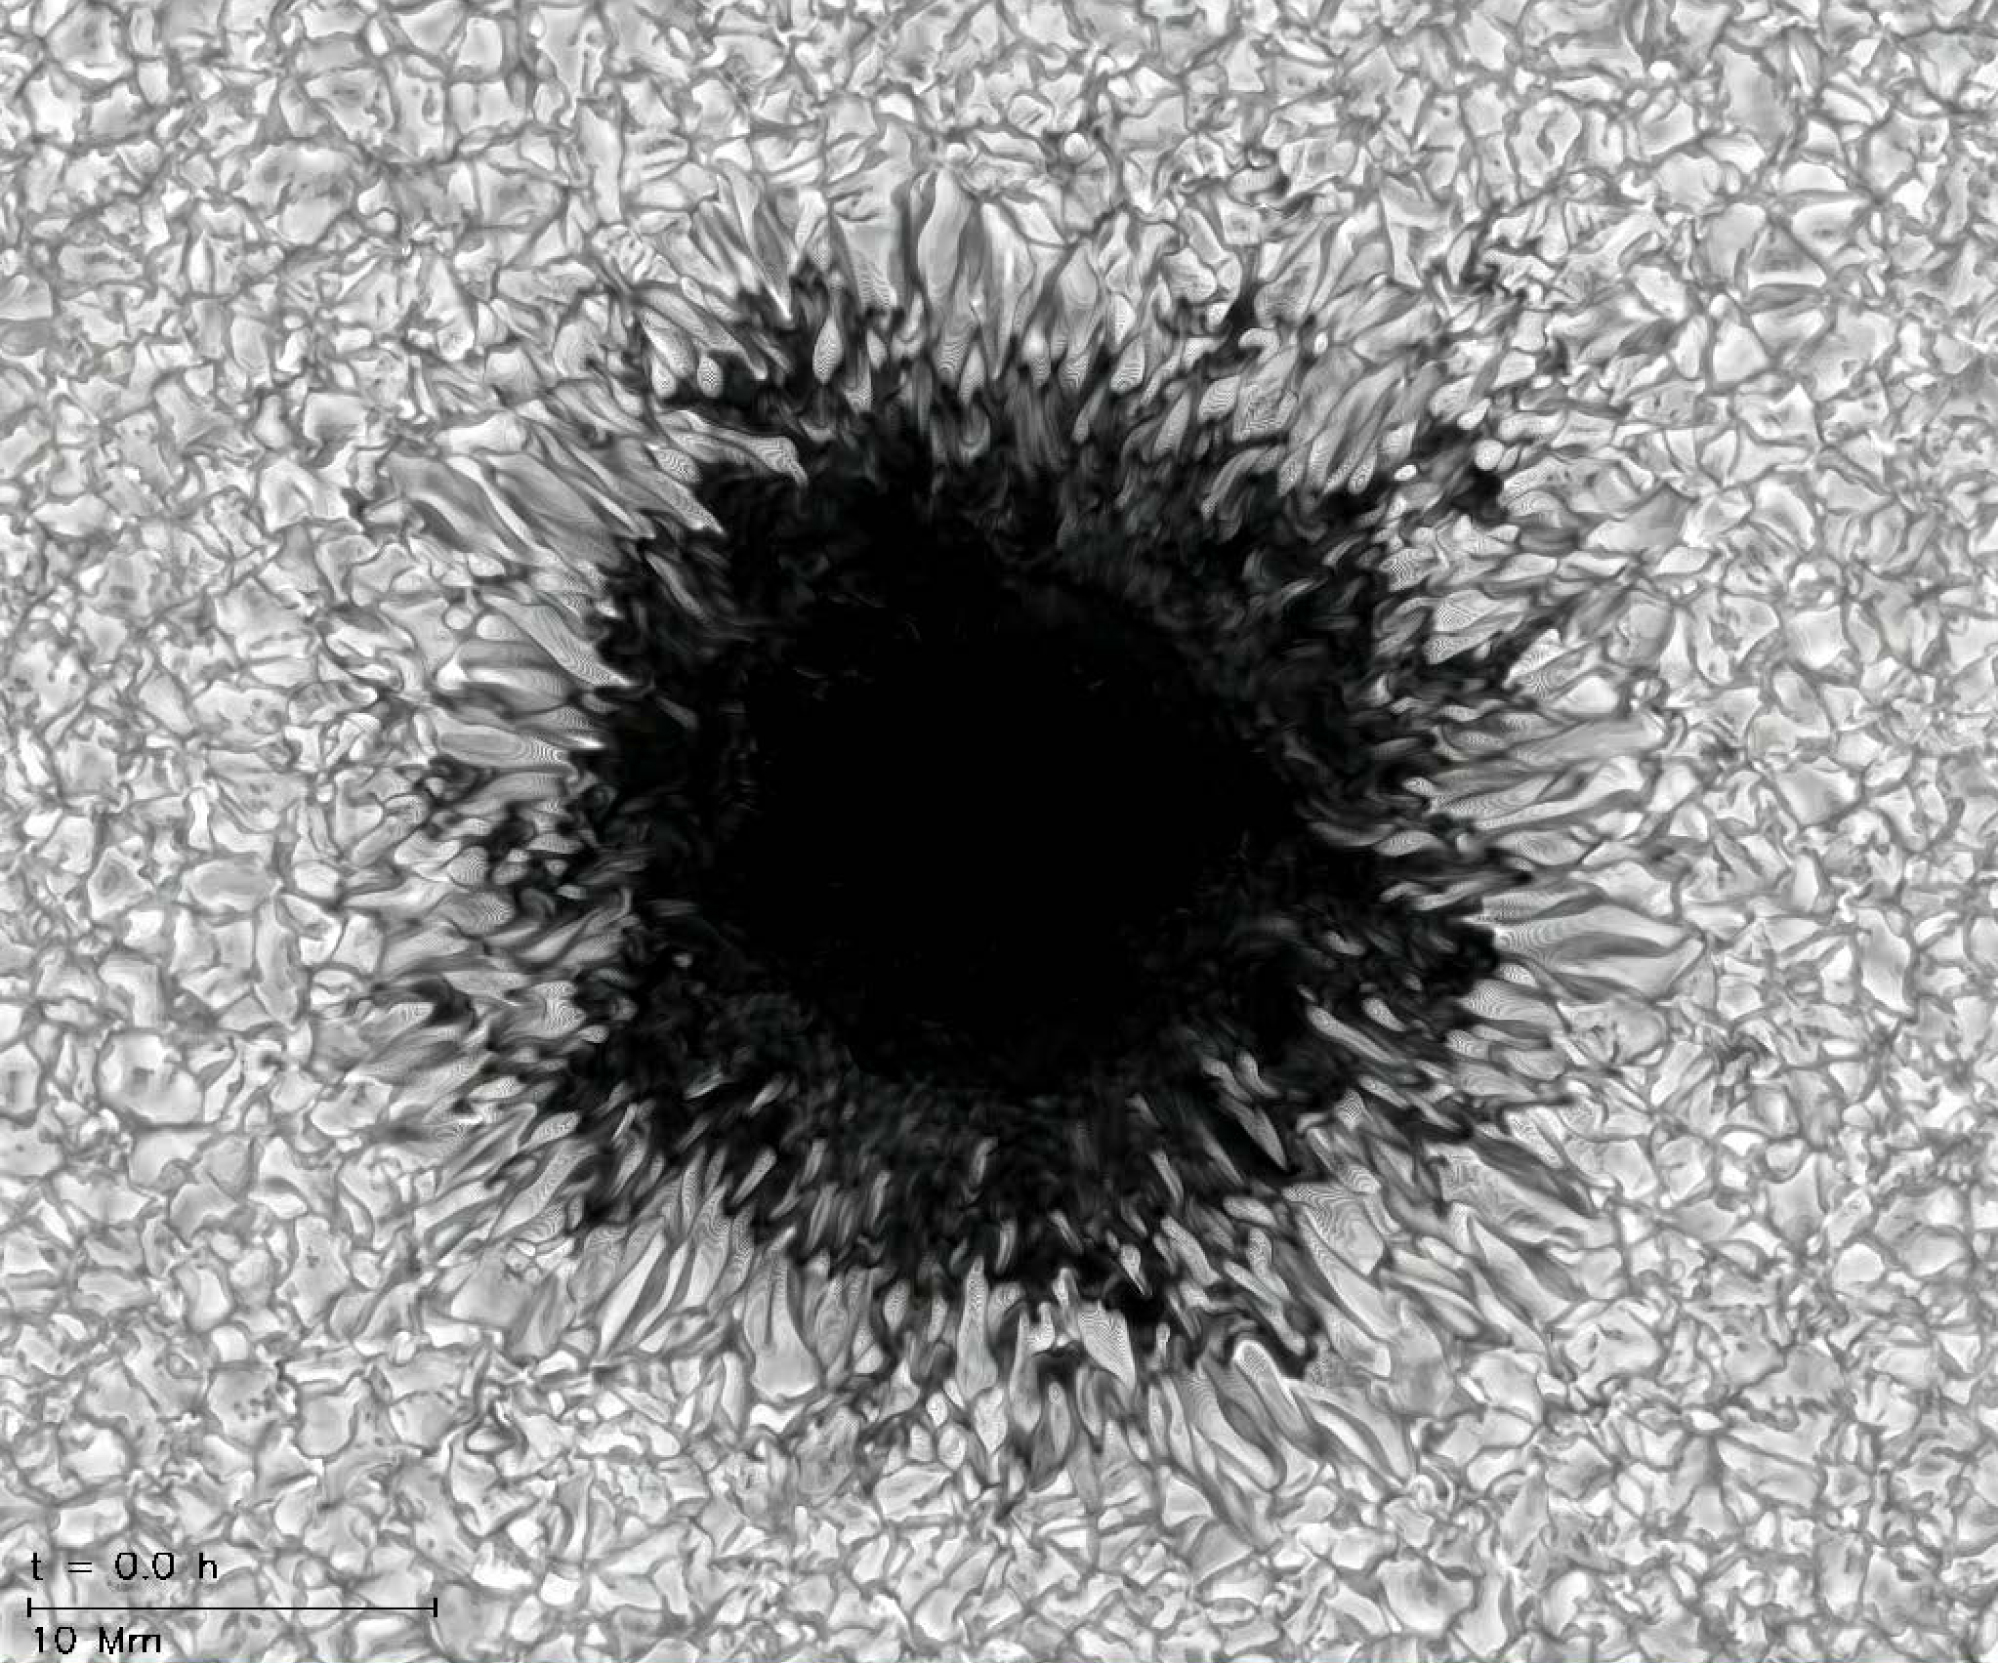
How do you build a sun spot? Previously one needed a sun, which is very inconvenient in terms of logistics and safety issues. It turns out that now you can build one with just an amazing computer code and a large supercomputer, which is much more convenient and it runs out pretty darn effective. Below are a real and a simulation sunspot. I'll let you figure out which is which.


In a truly groundbreaking simulation, Matthias Rempel of the National Center for Atmospheric Research here in Boulder has created a realistic simulation of a sunspot that appears to correctly reproduce almost all of a the observed features of real sunspots.
This is the kind of numerical model most of us computational scientists dream about at night.

In a truly groundbreaking simulation, Matthias Rempel of the National Center for Atmospheric Research here in Boulder has created a realistic simulation of a sunspot that appears to correctly reproduce almost all of a the observed features of real sunspots.
This is the kind of numerical model most of us computational scientists dream about at night.
Wednesday, August 25, 2010
Spots in Southern California, Part 1
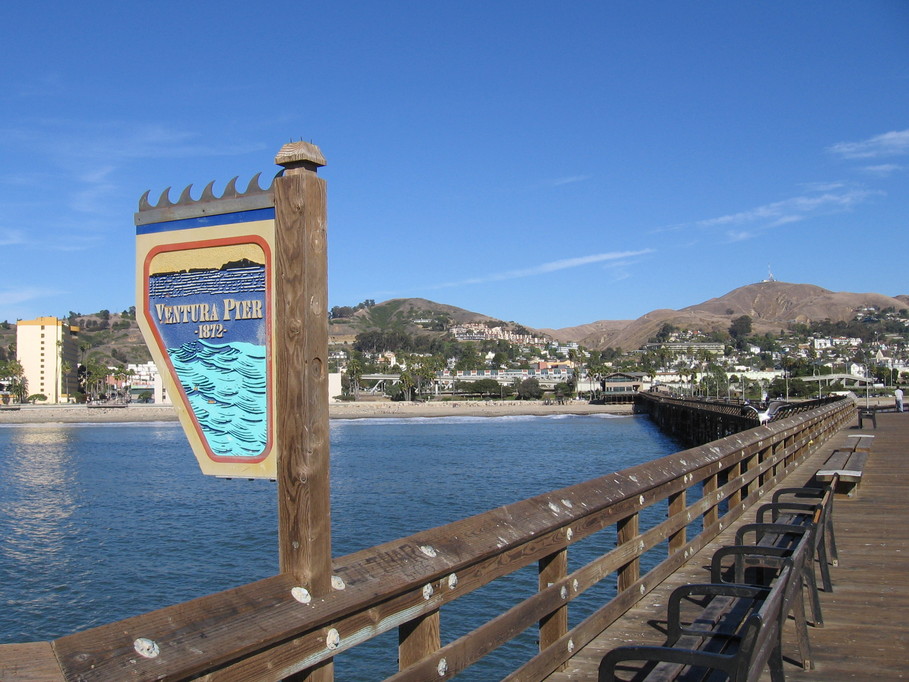
This week I'm in lovely Ventura, California for the International Astronomical Union's symposium #273 entitled "The Physics of Sun and Star Spots". In the tradition of holding conferences in which one spends 12 hours a day in a darkened room listening to highly technical presentations on often poorly prepared slides in beautiful locations, the conference is being held at a hotel less than 100 feet from the ocean.
 In fact if you look at the picture on the right which was taken from the Ventura pier, you can actually see the hotel (just the left of the sign). For the few hours I've actually gotten outside in daylight it's a fantastic location.
The meeting has been great so far. With both the Kepler Space Telescope and the Solar Dynamics Observatory currently online, we are getting a wealth of new data on solar and stellar spots. On top of that, steady improvements in computational capabilities and remarkable advances in numerical algorithms, we are starting to get a handle on the physics behind all of the spots we see on the sun and other stars. Here are a few of the highlights.
The meeting has been great so far. With both the Kepler Space Telescope and the Solar Dynamics Observatory currently online, we are getting a wealth of new data on solar and stellar spots. On top of that, steady improvements in computational capabilities and remarkable advances in numerical algorithms, we are starting to get a handle on the physics behind all of the spots we see on the sun and other stars. Here are a few of the highlights.
Sun Spots with SDO and Hinode
High resolution in both time and space is enabling observations of sunspots that explore some of the fundamental details of how sunspots emerge, evolve, and dissipate. It has been known since 1909 that sunspots drive supersonic fluid outflows called Evershed flows close to the actual spot and then much slower, larger inflows called moat flows further out. Observations of these flows on very small scales over the lifetimes of sunspots have led to a possibly unified explanation for both flows.
Tuesday, May 25, 2010
Video of Comet Crashing Into The Sun.
80 Beats pointed this out to me so go there for more details. Astronomers at the current AAS meeting in Miami just released this video. It shows the rare event of a comet crashing into the sun. Enjoy:
Tuesday, August 4, 2009
Will Humans View The Apolcalyse?
Okay, I am going to speak as a scientist. (In response to the last post.) I am well aware of what various scriptures say, but scientifically this quote by Martin Reese is correct and makes you wonder if humans will actually be around to observe the "real" apocalypse:
Given that there is ~6 Billion years for life to evolve on earth before the sun takes it out, it is very possible that the creatures on earth then will be as different from us as we are from bacteria. (If not more!)
Slate needs to add that scenario.
The sun has been shining for four and a half billion years, but it'll be another six billion years before its fuel runs out. On that schematic picture, a sort of timeless picture, we're halfway. And it'll be another six billion before that happens, and any remaining life on Earth is vaporized. There's an unthinking tendency to imagine that humans will be there, experiencing the sun's demise, but any life and intelligence that exists then will be as different from us as we are from bacteria.It is crazy to think of, but is true none the less. The difference between us and the simplest bacteria is the product of no more than ~4 billion years of evolution.
Given that there is ~6 Billion years for life to evolve on earth before the sun takes it out, it is very possible that the creatures on earth then will be as different from us as we are from bacteria. (If not more!)
Slate needs to add that scenario.
Thursday, April 2, 2009
The Sun's Recession
The economy is not the only entity facing a severe recession. It turns out you have to go back to 1913 to find a time when the sun was having so few sunspots. From NASA:
The sunspot cycle is behaving a little like the stock market. Just when you think it has hit bottom, it goes even lower.2008 was a bear. There were no sunspots observed on 266 of the year's 366 days (73%). To find a year with more blank suns, you have to go all the way back to 1913, which had 311 spotless days: plot. Prompted by these numbers, some observers suggested that the solar cycle had hit bottom in 2008.
Maybe not. Sunspot counts for 2009 have dropped even lower. As of March 31st, there were no sunspots on 78 of the year's 90 days (87%).
It adds up to one inescapable conclusion: "We're experiencing a very deep solar minimum," says solar physicist Dean Pesnell of the Goddard Space Flight Center.
"This is the quietest sun we've seen in almost a century," agrees sunspot expert David Hathaway of the Marshall Space Flight Center.

Friday, December 26, 2008
It May End With a Whimper, But The Solar System Started With A Bang
When studying stellar evolution, the really interesting stuff are the ways that high mass stars die - supernovae. Our sun, by comparison, will be far less exciting as it dies the slow death of a cooling white dwarf in about 5 billion years. However, a paper recently published by Boss et al (available here) and summarized nicely by Physics Today (available here) shows that the excitement in our solar system probably happened about 5 billion years in the other direction. Their research shows that our sun and its planets probably formed due to a supernova shock wave passing through.
The supernova shock wave theory had been around since the 1970's when it was discovered that meteorites in our solar system contained the decay products of aluminum-26 and iron-60. Aluminum-26 and iron-60 can only be produced naturally by supernovae and are both very short lived (in astronomical terms) with half-lives of 717,000 and 1,500,000 years respectively. For the decay products of these elements to be present in meteorites in our solar system, the solar system must have formed within a few hundred thousand years of a supernova explosion - an astronomical blink of an eye when you consider the age of our sun (~4.5 billion years). So either the supernova was an extremely unlikely coincidence or it caused the formation of our solar system.
The problem, however, was that when astrophysicists tried to model the collapse of a star-forming cloud due to a supernova shock wave passing through, the results were not pretty. Instead of initiating a collapse the shock wave actually tended to delay the collapse by heating the gas (causing it to expand) or even blowing the proto-solar cloud apart completely. So while the data clearly pointed towards supernova induced collapse, the mechanics of that process remained elusive.
The paper published by Boss et al. has finally solved the mystery. Using the FLASH code, they were able to show that the shock wave would compress the gas and start the collapse and that the heating caused by the shock could be radiated out of the cloud by molecules like molecular hydrogen, water, and carbon dioxide. The problem with previous models was that they used a rough parametrization for the radiative cooling while the FLASH simulations use a complex set of chemical reaction networks that provide much more physically accurate models for cooling. These simulations have answered a question that has been floating around for three decades that may never have been answered any other way.
On another note, I'd like to express my support for the model of modern code development that the FLASH code and others have helped to popularize. Twenty years ago when you wanted to run a simulation, you sat down and wrote your own code, used it once or twice, and then wrote another code for your next project. Today the problems in many areas of astrophysics are so complex that it would be impractical if not impossible for a single person to write a code that could do cutting edge research. The FLASH code incorporates advanced computational methods, cutting-edge algorithms for massive parallelization, hydrodynamic and magnetohydrodynamic solvers, massive nuclear and chemical reaction networks, general and special relativistic mechanics, radiative transfer models, particle physics, and more. No one person has the understanding and expertise to write a code that could do all of those things - and even if they did it would take an individual years to decades to produce a working code that contained it all.
FLASH was developed by a team that contained engineers, chemists, physicists, and computer scientists. It was written in the same way that most large pieces of commercial software are written. It is highly modular and very well documented. It is a code that can tackle problems like the one mentioned above because it includes so many diverse physical processes in a framework that allows the effective use of some of the world's largest supercomputers.
If more codes were written this way, more meaningful science would get done. I believe that in 10 years or so, almost all numerical science will use codes developed like FLASH.
I should also note that FLASH is not the only code to follow this model. Other codes large codes like the molecular dynamics code NAMDI, the cosmological codes ENZO and GADGET, and even some smaller ones like the code I use for solar and stellar convection models, ASH, were developed this way. FLASH is, however, probably the most well-known and best example of this new mode of code writing.
The supernova shock wave theory had been around since the 1970's when it was discovered that meteorites in our solar system contained the decay products of aluminum-26 and iron-60. Aluminum-26 and iron-60 can only be produced naturally by supernovae and are both very short lived (in astronomical terms) with half-lives of 717,000 and 1,500,000 years respectively. For the decay products of these elements to be present in meteorites in our solar system, the solar system must have formed within a few hundred thousand years of a supernova explosion - an astronomical blink of an eye when you consider the age of our sun (~4.5 billion years). So either the supernova was an extremely unlikely coincidence or it caused the formation of our solar system.
The problem, however, was that when astrophysicists tried to model the collapse of a star-forming cloud due to a supernova shock wave passing through, the results were not pretty. Instead of initiating a collapse the shock wave actually tended to delay the collapse by heating the gas (causing it to expand) or even blowing the proto-solar cloud apart completely. So while the data clearly pointed towards supernova induced collapse, the mechanics of that process remained elusive.
The paper published by Boss et al. has finally solved the mystery. Using the FLASH code, they were able to show that the shock wave would compress the gas and start the collapse and that the heating caused by the shock could be radiated out of the cloud by molecules like molecular hydrogen, water, and carbon dioxide. The problem with previous models was that they used a rough parametrization for the radiative cooling while the FLASH simulations use a complex set of chemical reaction networks that provide much more physically accurate models for cooling. These simulations have answered a question that has been floating around for three decades that may never have been answered any other way.
****************************
On another note, I'd like to express my support for the model of modern code development that the FLASH code and others have helped to popularize. Twenty years ago when you wanted to run a simulation, you sat down and wrote your own code, used it once or twice, and then wrote another code for your next project. Today the problems in many areas of astrophysics are so complex that it would be impractical if not impossible for a single person to write a code that could do cutting edge research. The FLASH code incorporates advanced computational methods, cutting-edge algorithms for massive parallelization, hydrodynamic and magnetohydrodynamic solvers, massive nuclear and chemical reaction networks, general and special relativistic mechanics, radiative transfer models, particle physics, and more. No one person has the understanding and expertise to write a code that could do all of those things - and even if they did it would take an individual years to decades to produce a working code that contained it all.
FLASH was developed by a team that contained engineers, chemists, physicists, and computer scientists. It was written in the same way that most large pieces of commercial software are written. It is highly modular and very well documented. It is a code that can tackle problems like the one mentioned above because it includes so many diverse physical processes in a framework that allows the effective use of some of the world's largest supercomputers.
If more codes were written this way, more meaningful science would get done. I believe that in 10 years or so, almost all numerical science will use codes developed like FLASH.
I should also note that FLASH is not the only code to follow this model. Other codes large codes like the molecular dynamics code NAMDI, the cosmological codes ENZO and GADGET, and even some smaller ones like the code I use for solar and stellar convection models, ASH, were developed this way. FLASH is, however, probably the most well-known and best example of this new mode of code writing.
Thursday, March 13, 2008
Sunspots
I have had a number of questions about sun spots, so instead of putting them in comments, I thought I'd give a brief overview in a post. Feel free to ask any questions you may still have in comments.
The life of a sunspot begins deep in the solar convection zone. Here tubes of strong magnetic field are generated by the dynamo processes. Examples of such magnetic structures appear in our simulations (although not yet our simulations of the sun - this one comes from a solar mass star spinning 3 times faster - but we're getting there), as seen here in a 3-D visualization that I made for the San Diego Supercomputing Center's 2008 calender. The blue and yellow-red bands are two loops of magnetic field in the middle of the convection zone. The fact that they even exist in the middle of violently turbulent convection is amazing - but that is another post. For right now, they are remarkable because they are regions of strong (as much as ~2 Tesla) magnetic field.
 Magnetic fields produce pressure in the fluid proportional to the square of the magnetic field. This causes the regions of extremely strong field to expand - thereby becoming less dense than the surrounding fluid. This results in the regions of strong field becoming buoyant and rising. Occasionally, one of these tubes of magnetic field lines makes it all the way through the convection zone and manages to rise out of the photosphere - the solar surface.
In plasmas, the fluid and the magnetic field are stuck together. In most of the sun, fluid forces are much greater than magnetic forces, so the fluid ends up dragging the magnetic field around. In areas of strong magnetic field, however, the magnetic forces dominate and so the fluid can no longer push the magnetic fields around. This means that in a sunspot, the fluid in the spot can no longer mix effectively with the fluid outside of the sunspot. This causes the fluid to cool (and become darker) as it is radiating all of its heat out into space without getting much from the hot plasma around or below it. Thus the sunspot is an indirect effect of the magnetic field looping in and out of the photosphere.
A great picture of a sunspot can be found below. This was taken by the Swedish Solar Telescope, which uses adaptive optics to get really amazing pictures. As you can see, the story I'm telling is a very simplified one, but it is essentially true. With convection turned off by the strong magnetic fields, the only way to get heat into a sunspot is via conduction - a much less efficient process near the solar surface than convection. Conduction , in part, causes the smearing that appears near the edge of sunspots. Solar flares and coronal mass ejections occur when the magnetic field sticks too far out of the solar surface in a upside-down U shape. At some point, the bottom ends of the U get too close together and "reconnect". This reconnection leaves a smaller U shape and a closed loop of magnetic field floating above the solar surface. This closed loop quickly decays, pumping all of the energy stored in the magnetic field into heat which essentially causes a massive explosion releasing magnetic energy as kinetic energy. This explosion can shoot huge amounts of x-rays and 10 million degree plasma into space. Occasionally, we happen to be unlucky enough to get in the way.
Sunspots always obey a few rules:
1) They can never appear alone. In the image above, there is an entire group of spots, which is quite common. But for every field line that exits the solar surface there must be a field line entering the solar surface. This means that sunspots dissapear together - even when there are explosive events like reconnection.
2)For reasons we still don't understand, for each 11 year solar cycle, all of the sunspots in northern hemisphere appear with the same leading polarity and all sunspots in the southern hemisphere will have the opposite polarity in the leading spot. For example, in the current solar cycle, all of the leading spots have the magnetic field pointing out of the surface and the trailing spots have the field pointing into the surface. Every 11 years, that polarity switches.
3)Most sunspots do not causes flares or coronal mass ejections - they simply fade away as the magnetic field slowly diffuses outward.
I hope that answers some questions. Please feel free to ask any more in the comments.
*********************************
The life of a sunspot begins deep in the solar convection zone. Here tubes of strong magnetic field are generated by the dynamo processes. Examples of such magnetic structures appear in our simulations (although not yet our simulations of the sun - this one comes from a solar mass star spinning 3 times faster - but we're getting there), as seen here in a 3-D visualization that I made for the San Diego Supercomputing Center's 2008 calender. The blue and yellow-red bands are two loops of magnetic field in the middle of the convection zone. The fact that they even exist in the middle of violently turbulent convection is amazing - but that is another post. For right now, they are remarkable because they are regions of strong (as much as ~2 Tesla) magnetic field.
 Magnetic fields produce pressure in the fluid proportional to the square of the magnetic field. This causes the regions of extremely strong field to expand - thereby becoming less dense than the surrounding fluid. This results in the regions of strong field becoming buoyant and rising. Occasionally, one of these tubes of magnetic field lines makes it all the way through the convection zone and manages to rise out of the photosphere - the solar surface.
In plasmas, the fluid and the magnetic field are stuck together. In most of the sun, fluid forces are much greater than magnetic forces, so the fluid ends up dragging the magnetic field around. In areas of strong magnetic field, however, the magnetic forces dominate and so the fluid can no longer push the magnetic fields around. This means that in a sunspot, the fluid in the spot can no longer mix effectively with the fluid outside of the sunspot. This causes the fluid to cool (and become darker) as it is radiating all of its heat out into space without getting much from the hot plasma around or below it. Thus the sunspot is an indirect effect of the magnetic field looping in and out of the photosphere.
A great picture of a sunspot can be found below. This was taken by the Swedish Solar Telescope, which uses adaptive optics to get really amazing pictures. As you can see, the story I'm telling is a very simplified one, but it is essentially true. With convection turned off by the strong magnetic fields, the only way to get heat into a sunspot is via conduction - a much less efficient process near the solar surface than convection. Conduction , in part, causes the smearing that appears near the edge of sunspots.
 Solar flares and coronal mass ejections occur when the magnetic field sticks too far out of the solar surface in a upside-down U shape. At some point, the bottom ends of the U get too close together and "reconnect". This reconnection leaves a smaller U shape and a closed loop of magnetic field floating above the solar surface. This closed loop quickly decays, pumping all of the energy stored in the magnetic field into heat which essentially causes a massive explosion releasing magnetic energy as kinetic energy. This explosion can shoot huge amounts of x-rays and 10 million degree plasma into space. Occasionally, we happen to be unlucky enough to get in the way.
Sunspots always obey a few rules:
1) They can never appear alone. In the image above, there is an entire group of spots, which is quite common. But for every field line that exits the solar surface there must be a field line entering the solar surface. This means that sunspots dissapear together - even when there are explosive events like reconnection.
2)For reasons we still don't understand, for each 11 year solar cycle, all of the sunspots in northern hemisphere appear with the same leading polarity and all sunspots in the southern hemisphere will have the opposite polarity in the leading spot. For example, in the current solar cycle, all of the leading spots have the magnetic field pointing out of the surface and the trailing spots have the field pointing into the surface. Every 11 years, that polarity switches.
3)Most sunspots do not causes flares or coronal mass ejections - they simply fade away as the magnetic field slowly diffuses outward.
I hope that answers some questions. Please feel free to ask any more in the comments.
Thursday, September 20, 2007
"Public" Science
 Last week I got an e-mail from the San Diego Supercomputing Center asking if I would be willing to provide one of the images for their 2008 calendar. Every year SDSC puts out a calendar that they give to people that donate money, funding agencies, people that SDSC wishes would give them money, etc. Since July, I have been working with Steve Cutchin, director of visualization services at SDSC, on adapting our data and his 3-D volume rendering program, Vista, to work with each other. It's been a productive collaboration and I've enjoyed working with Steve, so when SDSC came calling, I was happy to provide one of the images and a short caption.
Little did I know what I was getting myself into. I have made publication quality figures before and I know that a good figure is a bit of trick, but "public" quality figures are a different story. The image I submitted is shown on the right, and let me tell you, it's hard to try and make a scientific image both visually appealing and, in some small degree, understandable to someone who does work in astrophysical fluid dynamics.
The image shows the large (greater than 5 Tesla in magnitude) components of the toroidal magnetic field (red positive, blue negative) in one of our simulations of a sun-like star spinning at three times the solar rate. As you can see, the star's rotation has organized the random, chaotic small magnetic fields generated by the turbulent convection below the star's surface into strong, organized magnetic fields that last for thousands of days (as long as we've run the simulations).
In the sun, the global magnetic fields are believed to be generated in random, small segments in the turbulence of the sun's convection zone and then pulled by down-flows into a region where the sun switches differential rotation (near the Sun's surface, the equator rotates faster than the poles) to solid body rotation rather abruptly. This region of strong shear known as the tachocline organizes the magnetic field into large, coherent structures.
The reason that the image above is remarkable is that in this simulation, there was no tachocline. The simulated region only covered the convection zone, so in some way, this star was able to organize its magnetic field without a layer of strong shear. As far as we know, this is the first time this has ever been demonstrated and there is no known theoretical method for creating this type of field - yet there it is.
The problem is how on earth do I convey the importance of this image to non-physicists in a three sentence caption?
Sadly, the answer is that I can't. It is simply not possible to explain the importance of this image if it is displayed opposite the month of March or June. So the question then becomes, what is my objective? Do I even try to explain what the image means or do I just go for the "Wow, that's very important science" effect?
I'm not sure that there is a good answer to this question, and it certainly isn't going away anytime soon. So how do we make our physics relevant to the public?
Monday, August 27, 2007
 Low energy solar neutrinos have finally been detected. This confirms current theory that neutrinos oscillate between three types on their journey from the sun to earth. From the NSF:
An international team of researchers has detected low-energy solar neutrinos--subatomic particles produced in the core of the sun--and measured in real-time the rate the particles hit our planet.
The researchers also obtained fresh evidence that neutrinos oscillate (transform from one state to another) before arriving at Earth, adding weight to present theories about the nature of neutrinos and the inner workings of the sun and other stars.
The team of more than 100 researchers, including National Science Foundation (NSF)-supported investigators at Princeton University and Virginia Tech, have operated the so-called Borexino experiment in one of the deepest laboratories in the world, the Gran Sasso Laboratory of the Istituto Nazionale di Fisica Nucleare (INFN, the Italian National Institute of Nuclear Physics), near the town of L'Aquila, Italy.
These are the first results from the Borexino experiment that has been under construction since the late 1990s with the support of INFN as the lead agency, NSF in the United States, and institutions in Germany, France and Russia.
"In making these first direct measurements of low-energy neutrinos coming from the sun, Borexino represents a convergence of our present understanding of neutrino properties and the physics of solar energy generation," said Brad Keister, program director for nuclear physics in NSF's mathematical and physical sciences directorate.
"The great depth of the laboratory and the incredible purity of the materials used in the detection were critical to the discovery and demonstrated the impact of eliminating background radiation from such experiments," added Keister.
Produced in the Big Bang, and more recently in stars and nuclear reactors, neutrinos are everywhere. They constantly bombard the Earth, but because they interact very weakly, chances are slim a neutrino will hit anything. More than 100,000,000,000,000 pass through each of us every second without our noticing them.
The 18-meter (59-foot) diameter Borexino detector lies more than a kilometer (almost a mile) underground in one of the planet's deepest laboratories. The depth blocks out cosmic rays and other radiation sources that could create additional background signals.
The detector is comprised mainly of concentric layers of radiation shielding. Within an external tank filled with 2,400 tons of water, an enormous stainless steel sphere lies anchored. Within the sphere are two nested nylon vessels, each containing successively purer detector fluids.
Neutrinos knock electrons out of atoms in the detector fluid, and in turn, the electrons generate photons as they travel further through the liquid environment...
The research preprint is now available online at the arXiv server, a leading pre-publication posting site for physics discoveries.
Monday, April 23, 2007
Nick "The Sun Worshiper"
We all know what Nick will be up to in Colorado next year, so he needed a cool "Nick"name. Something other then "The Yellow Dart" since that is already taken. I thought we should give him one he could be proud of.
Being as that this is the case I decided to post some new images about the sun just released by NASA. These are the first 3D images ever taken of the sun.(Remember, you saw them here first. We at The Eternal Universe try to keep everyone up-to-date) Honestly, put on some 3D glasses and have an enjoyable experience.


Being as that this is the case I decided to post some new images about the sun just released by NASA. These are the first 3D images ever taken of the sun.(Remember, you saw them here first. We at The Eternal Universe try to keep everyone up-to-date) Honestly, put on some 3D glasses and have an enjoyable experience.


Monday, January 15, 2007
Fortress To Replace Fortran
Java, whether yo like it or not, is perhaps the most revolutionary programming language since C++. Java set a new standard for object oriented languages.
Sun Microsystems, who wrote Java, has a new language they are working on called Fortress. Here are the two main goals:

I'm sure some readers are skeptical, but I hope Sun pulls it off. Wouldn't it be wonderful if the the most powerful and efficient supercomputing language was written in a syntax easilly recognized and implemented by all scientists? Sun's motto for Fortress is "Do for Fortran what Java did for C." In the proper context, Java revolutionized C.(Like commercial software) Hopefully, in the supercomputing context, Fortress will do the same for Fortran. That would be great.
The only unfortunate thing is, they claim they have so many features they want to implement, it won't be ready until 2010. :( Since it is in such infancy, the above notation may evolve into something even easier to work with. Also, since it will be open sourced, expect lots of libraries and extensions from worldwide users which I think can be really helpful.
Sun Microsystems, who wrote Java, has a new language they are working on called Fortress. Here are the two main goals:
- Be the most powerful and efficient programming language for supercomputing.
- Use mathematical syntax, not traditional programming syntax, so that scientists are more at home with the language

I'm sure some readers are skeptical, but I hope Sun pulls it off. Wouldn't it be wonderful if the the most powerful and efficient supercomputing language was written in a syntax easilly recognized and implemented by all scientists? Sun's motto for Fortress is "Do for Fortran what Java did for C." In the proper context, Java revolutionized C.(Like commercial software) Hopefully, in the supercomputing context, Fortress will do the same for Fortran. That would be great.
The only unfortunate thing is, they claim they have so many features they want to implement, it won't be ready until 2010. :( Since it is in such infancy, the above notation may evolve into something even easier to work with. Also, since it will be open sourced, expect lots of libraries and extensions from worldwide users which I think can be really helpful.
Subscribe to:
Posts (Atom)